ElasticSearch in Production
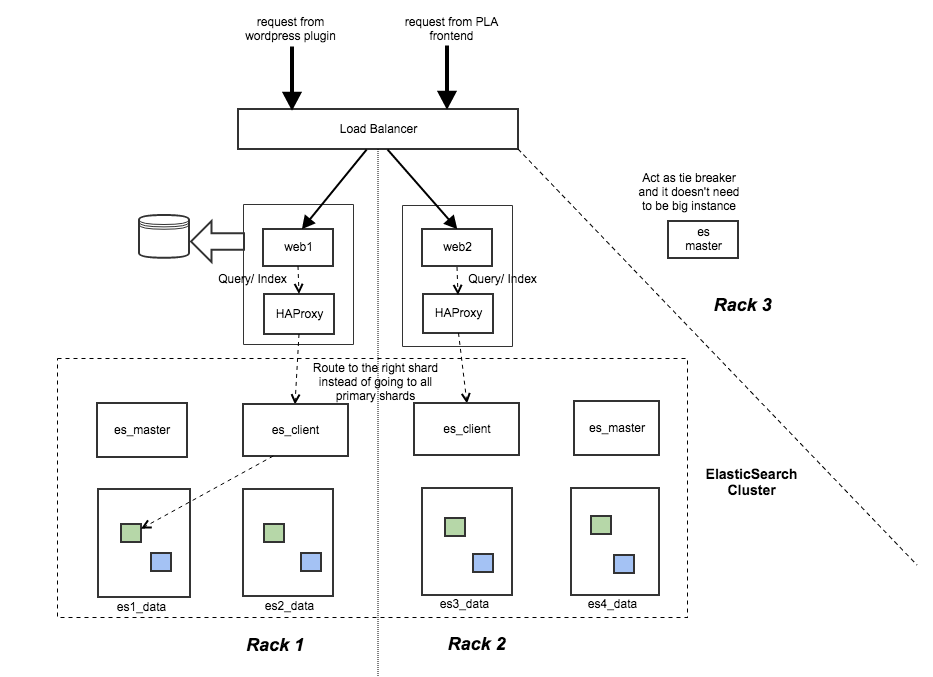
Recommended Deployment Architecture
Document how we set up our elasticsearch cluster and the reasonings behind our settings.

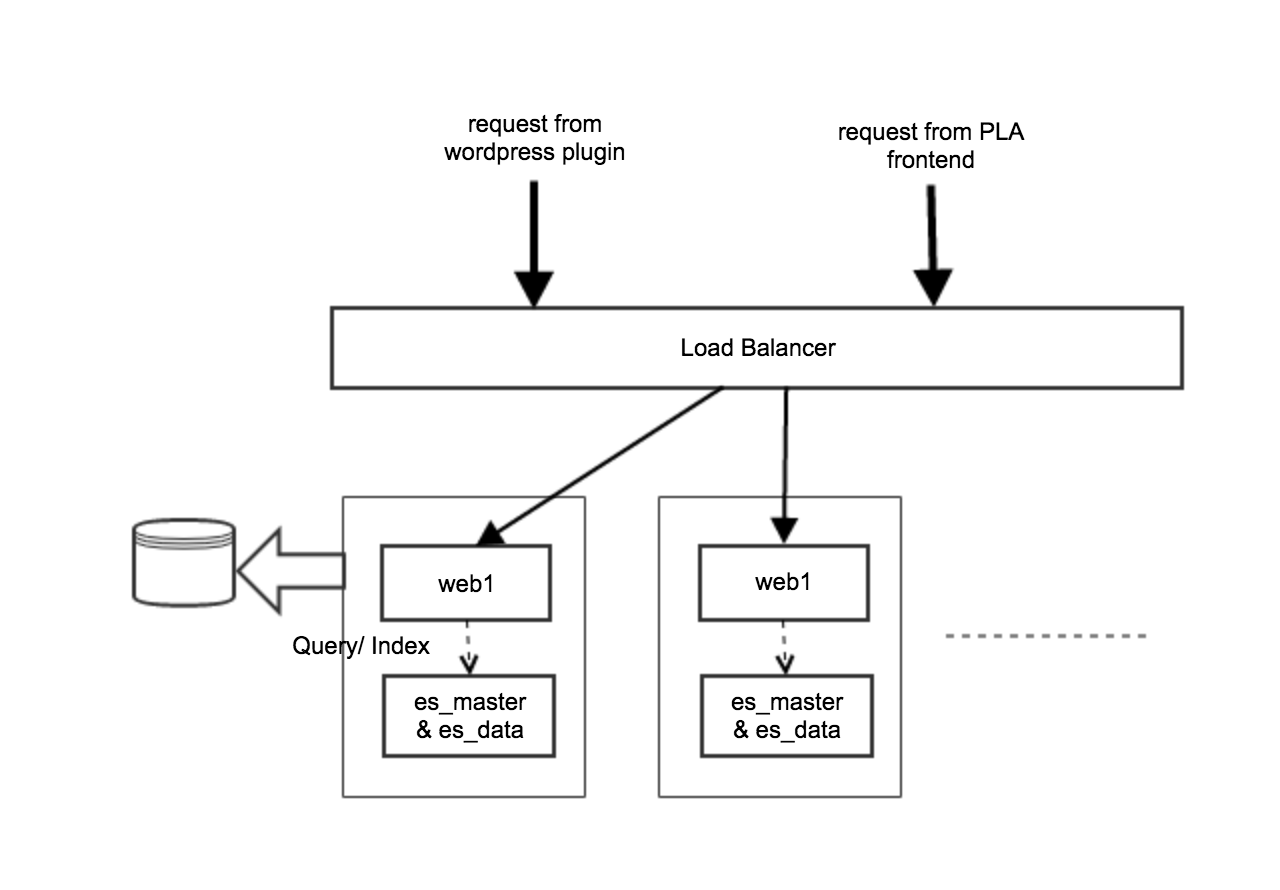
Simplified Deployment Architecture
- same configuration across all nodes
- Our application layer is more like a thin layer for security protection and management. It doesn't consume that much of resources and we also factor out mysql. As webapp and ES run at different JVM instances, 2G of memory will be used by the webapp. Since our box has 64G of RAM, it is not a big deal.
- If we use 3 boxes and we do replica of 2, each node will hold full data set. So, our query can include local as preference to avoid remote call. In distributed environment, the better we can avoid the remote call the better the system can scale. Later on, if we grow our data size, we will introduce data nodes and eat up some remote calls.

ElasticSearch level
(1) Memory Management

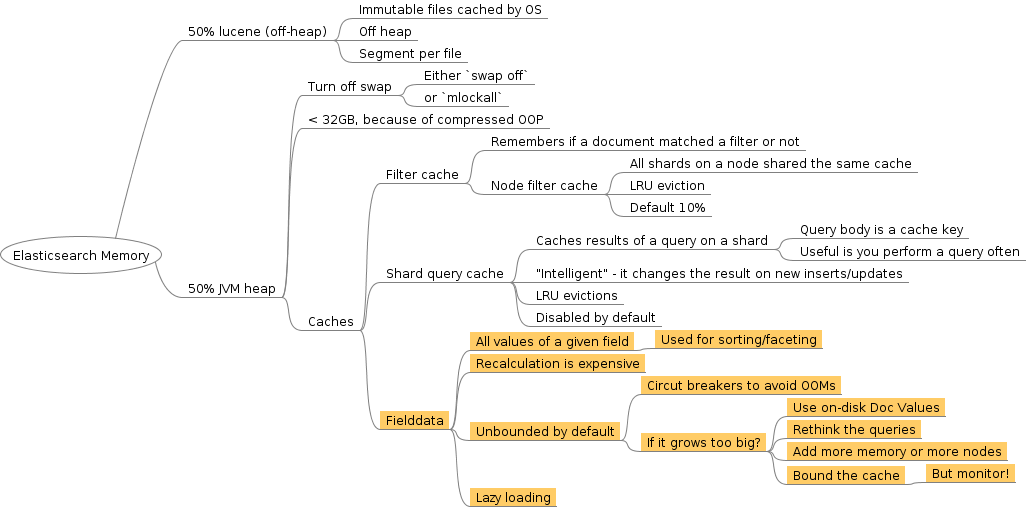
50% heap and 50% off heap
# elasticserach startup script
export ES_USE_GC_LOGGING=yes

# rule: half of your memory available but ensure < 31G.
# So, you will use HotSpot's compression oops and provide enough memory for file system cache that lucene heavily uses.
# This also means that there should not be a bunch of other processes fighting for file system cache resources (e.g. a MySQL database).
# The more processes the more chances a file read will go to the disk and therefore slow the Lucene operations down.

export ES_HEAP_SIZE=30G.
If heap > 6G, you may benefit from using G1GC garbage collector. But both ES and Lucene people not recommend it. On the other hand, it is regularly tested with G1GC. In case you want to give a trial, here is how to do it:
# elasticserach startup script
# enable G1GC, taken from
# https://github.com/elasticsearch/elasticsearch/issues/5823#issuecomment-59782959

export ES_JAVA_OPTS="-XX:-UseParNewGC -XX:-UseConcMarkSweepGC -XX:+UseG1GC"
Or you want to stick with the recommendation but just want to make the garbage collector running quick and frequent.
export ES_JAVA_OPTS="-XX:-UseParNewGC -XX:-UseConcMarkSweepGC -XX:+AlwaysPreTouch"
Finally, you may find that your heap fills up and stays full. If that becomes a problem, you may want to adjust your field data cache size.
Set bootstrap.mlockall: true
mlockall is set to false by default. It means ES node will allow memory swapping. But your box will be slow if memory is swapping back and forth between disk and memory. After you change this field, restart the ES and confirm the change via:
# elasticsearch.yml
bootstrap.mlockall
Test it via:
curl http://localhost:9200/_nodes/process?pretty
But if you set mlockall to true, make sure you give enough memory ot the ES node.
Set fielddata cache size
The field data cache is used mainly when sorting on or aggregating on a field. It loads all the field values to memory in order to provide fast document based access to those values. It could consume a lot of your heap! NOTE: this is only for non_analyzed field but not full text field
By setting an upper limit on the cache size, Elasticsearch evicts the least recently used entries if the cache is close to its limit, thus preventing the circuit breaker to kick in.
# elasticsearch.yml

# query cache size (absolute # like 1g or % of heap)
indices.fielddata.cache.size=70%

# fielddata circuit breaker (throw CircuitBreakingException if exceeded)
indices.fielddata.breaker.limit=80%

# per request level circuit breaker
indices.breaker.request.limit=40%

# combine both request and fielddata memory size and apply this limit
indices.breaker.total.limit=85%
While fielddata defaults to loading values into memory on the fly, this is not the only option. It can also be written to disk at index time in a way that provides all the functionality of in-memory fielddata, but without the heap memory usage. This alternative format is called doc values. The tradeoff is about 10–25% slower than in-memory fielddata. So, The more filesystem cache space that you have available, the better doc values will perform. If the files holding the doc values are resident in the filesystem cache, then accessing the files is almost equivalent to reading from RAM. And the filesystem cache is managed by the kernel instead of the JVM. To enable the field to use doc_value, do it on your mapping. For example:
PUT /music/_mapping/song
{
  "properties" : {
    "tag": {
      "type":       "string",
      "index" :     "not_analyzed",
      "doc_values": true
    }
  }
}
By far the biggest user of the heap for most users is in-memory fielddata, used for sorting, aggregations and scripts. In-memory fielddata is slow to load, as it has to read the whole inverted index and uninvert it. If the fielddata cache fills up, old data is evicted causing heap churn and bad performance (as fielddata is reloaded and evicted again.). No wonder in the ElasticSearch roadmap 2.0, they decide to have doc_values:true by default for all non_analyzed field.
(2) Determine Node Topology and Identity
Identity
# elasticsearch.yml
cluster.name: iss_prod

# cluster name, instance number and role (data or master). Below is just an example
node.name: iss_prod_001_data
Roles in Topology
There are three different kinds of nodes you can configure in Elasticsearch:
- Data Node
- You want this node to never become a master node, only to hold data. This will be the "workhorse" of your cluster.
- index and query response
- This kind of nodes needs enough storage, cpu and memory.
- You want this node to never become a master node, only to hold data. This will be the "workhorse" of your cluster.
- Dedicated Master Node
- Master nodes are potential candidates for being elected master of a cluster. A cluster master holds the cluster state and handles the distribution of shards in the cluster. In fact, it takes care of the well-being of the cluster. When a cluster master goes down, the cluster automatically starts a new master election process and elects a new master from all the nodes with the master role.
- Dedicated master node means you just have this node served as master without storing data.
- At least 3 in our cluster and always have odd number. The quorum should be set to N/2+1 where N is number of master nodes. This way you can avoid split brain issue with your cluster.
- This node tends not be heavily loaded so that can be quite small
- Client Node
- Client nodes respond to the ElasticSearch REST interface and are responsible for routing the queries to the data nodes holding the relevant shards and for aggregating the results from the individual shards.
- Consume lots of memory as all gathered response from different shards are all in memory.
- This act as a "search load balancer".
- Default - play 3 roles in single node
# elasticsearch.yml
# You can exploit these settings to design advanced cluster topologies.

# Data Node
#node.master: false
#node.data: true

# Dedicated Master Node
#node.master: true
#node.data: false

# 3. Client Node
#node.master: false
#node.data: false
Discovery
To discover nodes and avoid split brain, you need to configure some discovery zen properties:
# elasticsearch.yml

discovery.zen.fd.ping_timeout: 30s
discovery.zen.minimum_master_nodes: 2
discovery.zen.ping.multicast.enabled: false
discovery.zen.ping.unicast.hosts: ["iss_prod_001_master","iss_prod_002_master"]
The above properties say that node detection should happen within 30s and minimum 2 out of 3 master nodes should be detected by other nodes. The discovery method used is unicast and the unicast hosts are the 3 master nodes.
(3) Index Configuration
- Shard number is once set then fixed
- Replica number can be changed in runtime
How to calculate the shard number?
# suggested
number_of_shards = index_size / max_shard_size
Then how to get the max shard size? It is the data size that you load and your query starts slowing down.
- Grab a box with spec the same as the one you use in production.
- Configure it with single shard with 0 replica
- Load live data to it and test query performance
- Continue to load til you see your query slowed down and it will be your max shard size.
# number of shards of an index (default=5)
index.number_of_shards: 50

# number of replica of an index
index.number_of_replicas: 1

# the ability to compress stored fields
index.store.compress.stored: true

# The ability to compress data by term vector
index.store.compress.tv: true

# async refresh interval of a shard
index.refresh_interval: 5s

# turn off auto index creation
action.auto_create_index: false
(4) I/O
Open File Limit
The ElasticSearch process can use up all file descriptors in the system. If this is the case make sure the file descriptor limit is set high enough for the user running the ElasticSearch process. Setting it to 32k or even 64k is recommended.
# configure your system

sudo vi /etc/security/limits.conf
Add:
elasticsearch soft nofile 64000
elasticsearch hard nofile 64000

sudo vi /etc/pam.d/su
Uncomment pam_limits.so

sudo service elasticsearch restart
Check and see if it takes effect
GET /_nodes/process

{
   "cluster_name": "iss_prod",
   "nodes": {
      "TGn9iO2_QQKb0kavcLbnDw": {
         "name": "iss_prod_005_data",
         "transport_address": "inet[/192.168.1.131:9300]",
         "host": "zacharys-air",
         "ip": "192.168.1.131",
         "version": "2.0.0-SNAPSHOT",
         "build": "612f461",
         "http_address": "inet[/192.168.1.131:9200]",
         "process": {
            "refresh_interval_in_millis": 1000,
            "id": 19808,
            "max_file_descriptors": 64000,
            "mlockall": true
         }
      }
   }
}
Disk Speed
Medium and big hardware make more economical sense. Because of the way Lucene uses files (elaborate), SSDs are particularly suited, it is recommended to use RAID for performance only, and take advantage of ElasticSearch replicas for fault tolerance.
Data, Plugin and Log Paths Configuration
Specify the path where your data and log store otherwise elasticsearch upgrade could override /etc/elasticsearch folder and remove your data.
NOTE: Data can be saved to multiple directories, and if each directory is mounted on a different hard drive, this is a simple and effective way to set up a software RAID 0. Elasticsearch will automatically stripe data between the different directories, boosting performance
# achieve RAID 0 in software
path.data: /path/to/data1,/path/to/data2

# Path to log files:
path.logs: /path/to/logs

# Path to where plugins are installed:
path.plugins: /path/to/plugins
(5) CPU
Don't touch threadpool setting according to ElasticSearch team.
(6) Security
Protect your indices from malicious deletion
action.disable_delete_all_indices: true
Lucene level
(1) Refresh interval
- defaults to 1s
- it can be specified at the cluster or index level.
curl -XPUT localhost:9200/_settings -d '{"index": {"refresh_interval": "600s"}}'
(2) Merge factor
- defaults to 10
- it can be specified at the cluster or index level.
curl -XPUT localhost:9200/_settings -d '{"index": {"merge.policy.merge_factor": 30}}'
Speed 9: Lucene Segment
Immutable segment for caching
Lucene stores data into immutable groups of files called segments. Immutable files are considered to be cache-friendly and underlying OS is designed to keep "hot" segments resident in memory for faster access. The end effect is that smaller indices tend to be cached entirely in memory by your OS and become diskless and fast. On the other hand, the more non-heap memory you allowed, the more segments are in memory. So, it is considered best practice to keep the indices that used most often on faster machines. But to make this happen, you will need to assign specific indicies to your faster nodes using routing.
# elasticsearch yml

# Tag your node
node.tag: mynode1

# assign your newly created index stats-09142015 to faster node
curl -XPUT localhost:9200/stats-09142015/_settings -d '{
    "index.routing.allocation.include.tag" : "mynode1,mynode2"
}'
How often to refresh and flush
Merge policies
As you index more data, more segments are created. Because a search in many segments is slow, small segments are merged in the background into bigger segments to keep their number manageable. And merge is an expensive operation esp for I/O. You can adjust the merge policy to influence how often merge happen and how big segments can get.
The overall purpose of merging is to trade I/O and some CPU time for search performance. Merging happens when you index, update, or delete documents, so the more you merge, the more expensive these operations get. Conversely, if you want faster indexing, you’ll need to merge less and sacrifice some search performance. 4 index.merge fields can be changed dynamically at runtime.
curl -XPUT localhost:9200/get-together/_settings -d '{
  "index.merge": {
    "policy": {
      "segments_per_tier": 5,
      "max_merge_at_once": 5,
      "max_merged_segment": "1gb"
    },
    "scheduler.max_thread_count": 1
  }
}'
Store and store throttling
Performance
https://www.elastic.co/guide/en/elasticsearch/reference/current/search-request-preference.html
References
- Taming a Wild Elasticsearch Cluster - by Wilfred Hughes
- How to avoid split brain problem in ElasticSearch - by Bogdan Dumiltrescu
- On ElasticSearch Performance by Francois Terrier
- http://gibrown.com/2014/01/09/scaling-elasticsearch-part-1-overview/
- http://gibrown.com/2014/02/06/scaling-elasticsearch-part-2-indexing/
- http://gibrown.com/2014/08/12/scaling-elasticsearch-part-3-queries/
- https://www.elastic.co/blog/found-elasticsearch-top-down
- https://www.elastic.co/blog/found-elasticsearch-from-the-bottom-up
- https://www.airpair.com/elasticsearch/posts/elasticsearch-robust-search-functionality
- https://blog.codecentric.de/en/2014/05/elasticsearch-indexing-performance-cheatsheet/
- http://igor.kupczynski.info/2015/04/06/fielddata.html
- http://www.ranfranco.com/2015/06/27/make-your-elasticsearch-cluster-balanced-as-possible/
- http://www.ragingcomputer.com/2014/02/logstash-elasticsearch-kibana-for-windows-event-logs